An Analysis of Voting Patterns, SNAP Benefits, and the November 1st Crisis
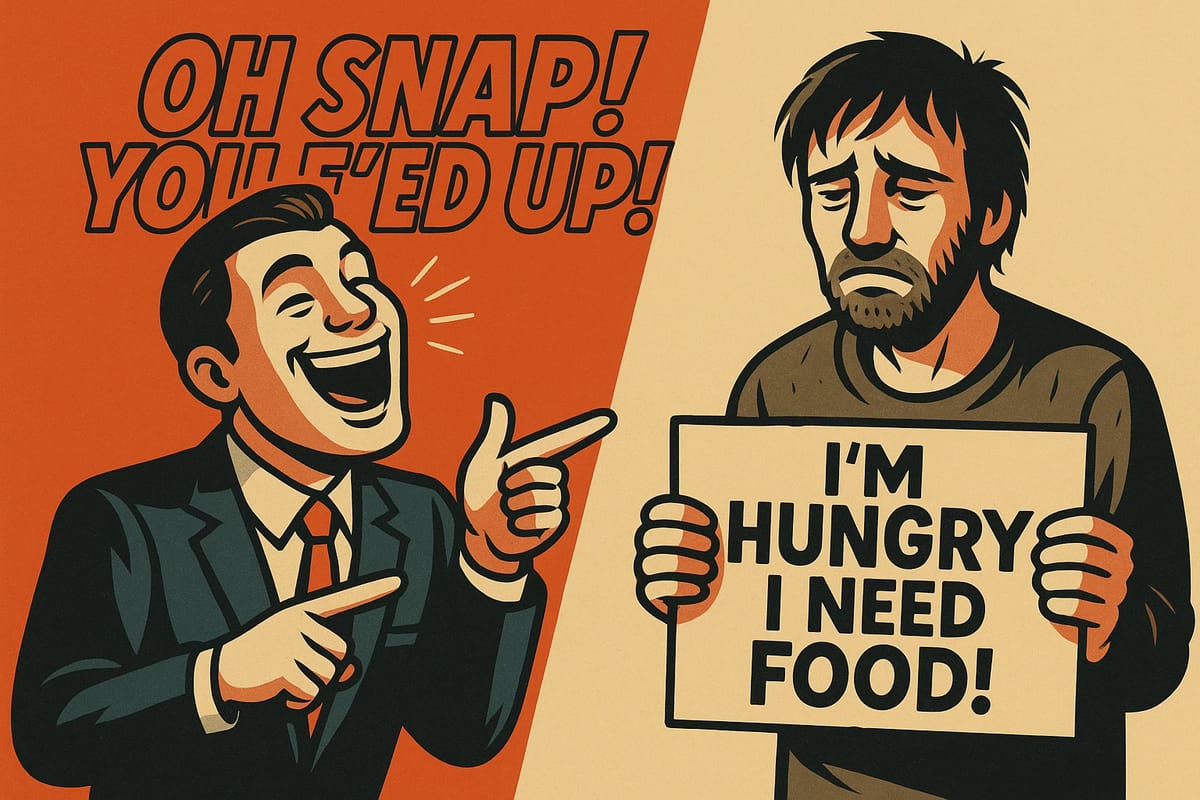
The intersection of political ideology and economic reality has created one of the most striking contradictions in American politics: millions of Trump supporters who rely on government assistance programs like SNAP voted for a president who campaigned explicitly on cutting those very programs. As Trump’s “One Big Beautiful Bill” enacted $186 billion in SNAP cuts over the next decade, approximately 42 million Americans now face potential suspension of food assistance benefits.
The Scale of Government Assistance Among Trump Voters
The data reveals a significant overlap between Trump’s electoral coalition and Americans who depend on government assistance:
Critical Numbers
- 53% of U.S. counties draw more than 25% of their income from government assistance
- 42% of all 2024 Trump voters say Medicaid is important to them and their families
- 46% of rural Trump supporters depend on Medicaid
- 17% of Republicans say they or someone in their household has used SNAP benefits
- 93% of rural counties voted for Trump in 2024—the highest share of any Republican presidential candidate this century
The Geographic Reality: Rural America’s Dependence
The contradiction is particularly stark in rural America, which forms the backbone of Trump’s electoral coalition.
Food Stamp Usage by County Voting Patterns
Among 3,131 U.S. counties analyzed:
- 2,021 counties reported increases in SNAP usage since 2010
- 78.7% of counties with increasing food stamp usage voted for Trump
- 21.3% of counties with increasing food stamp usage voted for Biden
Key Finding: Counties that have become more dependent on food assistance overwhelmingly vote Republican, despite Republicans campaigning to cut these programs.
This pattern has been consistent for over a decade, highlighting the deep-rooted nature of this political-economic paradox.
White Americans and Government Assistance
While discussions of government assistance often focus on communities of color, the data shows substantial participation by white Americans:
DemographicSNAP ParticipationAdditional DetailsWhite Households43.1% of all participants7.9% participation rate relative to populationWhite Women19% participation rateTwice as likely as white men (11%)Non-Hispanic Whites44.6% of adult recipientsBased on 2020 Census dataWhite Trump Voters55% of white votersWomen favored Trump by 4-point margin
The Gender Gap
- White women are twice as likely as white men to receive SNAP assistance (19% vs. 11%)
- In 2024, white women favored Trump by a narrow 4-point margin
- This means millions of white women who depend on SNAP voted for a candidate promising to cut their benefits
🚨 The November 1st Crisis Point
The contradiction has reached a critical juncture with the current government shutdown:
- USDA Notice: “Bottom line, the well has run dry. At this time, there will be no benefits issued November 01.”
- 42 million Americans will not receive SNAP benefits in November unless the agency changes position
- Rural communities hit hardest: 93% voted for Trump, yet have highest food insecurity rates
- 9.8 million rural school children face increased food insecurity
The Economic Consequences Now Unfolding
Trump’s policies are having immediate, measurable impacts:
Financial Impact on Families
- 22.3 million families affected by legislative changes
- 5.3 million families will lose at least $25/month in SNAP benefits
- Average loss: $146 per month for affected families
- Total cuts: $186 billion over next decade (20% reduction in SNAP funding)
New Restrictions
Expanded work requirements now apply to:
- Individuals ages 55-64
- Parents of children ages 14 and up
- Veterans
State-Level Impact
- California: 359,000 people could lose benefits from waiver elimination
- States with error rates above 6% must pay 5-15% of benefit costs
- Many states may cut benefits or opt out entirely
Understanding the Contradiction
Several factors explain why voters support candidates whose policies conflict with their economic interests:
1. Cultural and Identity Politics
- Trump broadened Republican appeal by attacking Wall Street elites
- Promised to maintain Social Security and programs rural Americans relied upon
- Heavy emphasis on anti-immigrant messaging and cultural conservatism
- Anti-urban sentiment expressing “those people” hostilities
“People vote their values first, but live their economic realities second. Trump supporters don’t back him for his healthcare policies. They’re motivated by cultural alignment and economic anxiety.”
— Michael Ryan, Financial Expert
3. Rural Resentment
Research identifies “rural resentment”—a sense that rural communities aren’t getting their fair share compared to cities—which can override economic considerations in voting decisions.
This voting pattern reflects fundamental changes in American politics:
Government Dependence and Republican Support
- Explosion of people getting 25%+ of income from government aid
- Republican reliance on votes from aid recipients
- Explains Trump’s rise and Republican Party transformation
- Traditional predictors like economic status no longer affect rural voting patterns
Historical Context
- Rural counties were modestly Republican before the 1990s
- Trump crystallized the urban-rural divide
- Rural areas suffered from two decades of deindustrialization
- Economic decline fueled anti-urban animus
Data Breakdown: Demographics and Voting
SNAP Recipients by Race (2020)
- White (non-Hispanic): 44.6% of adult recipients, 31.5% of child recipients
- Black: 27% of both adult and child recipients
- Hispanic: 21.9% of adult recipients, 35.8% of child recipients
Political Affiliation and Benefit Usage
- Democrats: 31% say household has used SNAP
- Republicans: 17% say household has used SNAP
- Conservatives: 17% have received food stamps (same as liberals/moderates)
Geographic Distribution
- Rural voters: 62% voted for Trump, 36% for Harris
- Suburban voters: Largest share of both Trump (49%) and Harris (56%) coalitions
- Urban voters: 28% of Harris voters vs. small Trump percentage
Case Studies: States in Focus
High-Dependence Republican States
States like Alabama and Mississippi:
- Among poorest in the country
- Heavily reliant on social programs
- Overwhelmingly vote Republican
- Rural communities economically devastated
Impact Examples
- North Carolina: Data excluded from national SNAP figures due to reporting issues
- Florida: Liberty County saw +21.6% increase in food stamp usage, voted Trump
- Nevada: Esmeralda County saw +22.7% increase, voted Trump
Expert Analysis: The Medicaid Connection
Healthcare Dependence Among Trump Voters
- 42% of Trump voters say Medicaid important to families
- 46% of rural Trump supporters depend on Medicaid
- 93% of all rural residents say Medicaid important
- 53% of all U.S. adults have family member who received Medicaid
Financial Reality vs. Political Identity
“Regardless if somebody is a Democrat or a Republican or a Trump supporter or not, financial hardship doesn’t care.”
— Chris Fong, Medicare Specialist
The November Crisis: Real-Time Impact
Government Shutdown Effects
- USDA contingency fund: $5-6 billion available
- Estimated need: $8 billion for November benefits
- Administration position: Won’t use contingency funds
- Political blame game: Republicans blame Democrats, Democrats cite hypocrisy
State Responses
- California: Deploying National Guard and $80M in state funding
- Wisconsin: Governor warns of “empty cupboards and stomachs”
- Arkansas/Oklahoma: Advising recipients to find food pantries
Historical Context: The Reagan Era to Trump
Evolution of Welfare Politics
- 1980s: Reagan cuts to food assistance programs
- 1990s: Clinton welfare reform with stricter work requirements
- 2000s: Bush administration expanded SNAP access
- Great Recession: Obama significantly increased benefits
- Trump Era: Systematic cuts and restrictions
The “Welfare Queen” Narrative Shift
- Reagan Era: Depicted fraudulent Black woman exploiting system
- Trump Era: White Americans claim victimhood from “reverse racism”
- Policy continuity: Same programs targeted, different racial messaging
Political and Economic Implications
2026-2028 Outlook
- Democratic positioning: Well-placed to advance pro-worker policies
- Republican challenge: Maintaining support while cutting benefits
- Working-class coalition: May expand beyond white voters
- Economic pressure: Rising costs may force policy reconsideration
Unresolved Questions
- Will crisis force reconsideration of political identity vs. economic interest?
- Can cultural factors continue outweighing material concerns?
- How will affected communities respond to benefit losses?
Methodology and Sources
Data Sources:
- Pew Research Center validated voter studies
- USDA Food and Nutrition Service statistics
- U.S. Census Bureau Survey of Income and Program Participation
- KFF health policy polling
- County voting records and demographic data
- Congressional Budget Office impact estimates
Analysis Period: 2016-2024 elections with historical context from 2010-2024
The Ultimate Irony
The data reveals a complex political reality where millions of Americans, particularly white Trump supporters in rural areas, depend on government assistance programs while voting for politicians who promise to cut those very programs.
Key Takeaways
- Geographic Paradox: 93% of rural counties voted Trump, yet these areas have highest food insecurity
- Demographic Reality: 43% of SNAP participants are white, yet 55% of whites voted Trump
- Economic Impact: $186 billion in cuts affecting 42 million Americans
- Cultural Override: Identity politics trumps immediate economic interests
The Bottom Line
As November 1st passes and food assistance potentially disappears for millions of Americans, those who most fervently supported Trump’s promises to cut “welfare” are discovering they are the primary recipients of the programs being eliminated—a lesson in the complex realities of American social policy that transcends simple partisan narratives about who depends on government assistance and why.
This analysis demonstrates the striking intersection of political identity, economic dependence, and policy consequences in modern American politics, where ideology often conflicts with immediate material needs.
This comprehensive analysis synthesizes data from multiple authoritative sources to examine one of the most significant political contradictions of our time.
Share this article
The link has been copied!